The scatterplot below suggests a linear relationship between the age (in years) of an antique clock and its sale price (in euros) at auction. The data are age and sale price for 11 antique clocks sold at a recent auction. 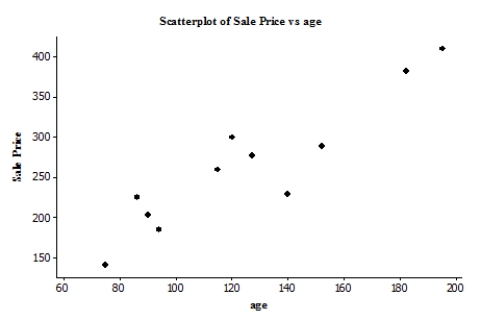 We fit the least-squares regression line to the model price = + (age) , where the deviations are assumed to be independent and Normally distributed, with mean 0 and standard deviation . A summary of the output is given. r2 = 0.848
S = 33.1559 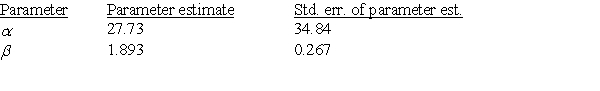 The correlation between the age of the antique clock and the auction price of the antique clock is:
A) -0.921.
B) 0.921.
C) -0.719.
D) 0.719.
Correct Answer:
Verified
Q14: You can visit the official website
Q15: A random sample of 19 companies
Q16: A random sample of 19 companies
Q17: You can visit the official website
Q18: You can visit the official website
Q20: The scatterplot below suggests a linear
Q21: The following is a scatterplot of a
Q22: A study of obesity risk in children
Q23: A study of obesity risk in children
Q24: A study of obesity risk in children
Unlock this Answer For Free Now!
View this answer and more for free by performing one of the following actions

Scan the QR code to install the App and get 2 free unlocks

Unlock quizzes for free by uploading documents