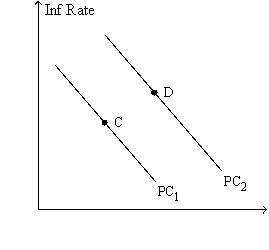
Figure 17-8. The left-hand graph shows a short-run aggregate-supply (SRAS) curve and two aggregate-demand (AD) curves. On the right-hand diagram, "Inf Rate" means "Inflation Rate."

-Refer to Figure 17-8. The shift of the aggregate-supply curve from AS1 to AS2 could be a consequence of
A) an increase in the money supply.
B) an adverse supply shock.
C) a decrease of output from Y1 to Y2.
D) a slow adjustment of people's expectation of the inflation rate.
Correct Answer:
Verified
Q3: An adverse supply shock will cause output
A)and
Q11: If there is an adverse supply shock,then
A)unemployment
Q20: Which of the following results in higher
Q128: If people anticipate higher inflation,but inflation remains
Q142: Country A has a higher money supply
Q144: For many years country A has had
Q183: An adverse supply shock will shift short-run
Q222: Figure 17-8. The left-hand graph shows a
Q224: Figure 17-8. The left-hand graph shows a
Q225: Figure 17-8. The left-hand graph shows a
Unlock this Answer For Free Now!
View this answer and more for free by performing one of the following actions

Scan the QR code to install the App and get 2 free unlocks

Unlock quizzes for free by uploading documents