Figure 16-3.
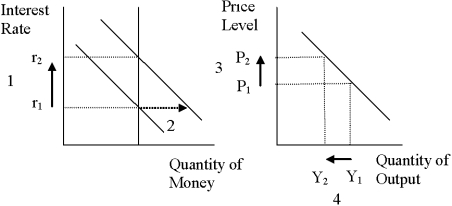
-Refer to Figure 16-3. What quantity is represented by the vertical line on the left-hand graph?
A) the supply of money
B) the demand for money
C) the rate of inflation
D) the quantity of bonds that was most recently sold or purchased by the Federal Reserve
Correct Answer:
Verified
Q63: According to liquidity preference theory,if the quantity
Q64: Figure 16-2. On the left-hand graph, MS
Q66: According to liquidity preference theory, if there
Q68: Figure 16-2. On the left-hand graph, MS
Q70: Figure 16-2. On the left-hand graph, MS
Q72: Figure 16-2. On the left-hand graph, MS
Q73: Figure 16-2. On the left-hand graph, MS
Q74: Figure 16-2. On the left-hand graph, MS
Q77: According to liquidity preference theory,if the quantity
Q78: The interest rate would fall and the
Unlock this Answer For Free Now!
View this answer and more for free by performing one of the following actions

Scan the QR code to install the App and get 2 free unlocks

Unlock quizzes for free by uploading documents