Figure 16-4. On the figure, MS represents money supply and MD represents money demand.
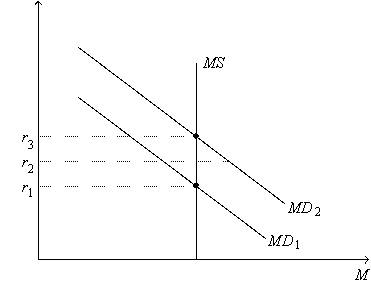
-Refer to Figure 16-4. Which of the following events could explain a shift of the money-demand curve from MD1 to MD2?
A) a decrease in the price level
B) a decrease in the cost of borrowing
C) an increase in the price level
D) an increase in the cost of borrowing
Correct Answer:
Verified
Q164: Figure 16-4. On the figure, MS represents
Q165: Figure 16-4. On the figure, MS represents
Q166: Charisse is of the opinion that the
Q167: Marcus is of the opinion that the
Q168: For the U.S.economy,money holdings are a
A)large part
Q170: Figure 16-4. On the figure, MS represents
Q190: The Fed can influence the money supply
Q192: The interest rate that the Federal Reserve
Q194: In response to the sharp decline in
Q195: In response to the sharp decline in
Unlock this Answer For Free Now!
View this answer and more for free by performing one of the following actions

Scan the QR code to install the App and get 2 free unlocks

Unlock quizzes for free by uploading documents