Figure 16-5. On the figure, MS represents money supply and MD represents money demand.
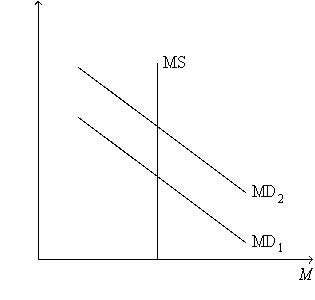
-Refer to Figure 16-5. What is measured along the vertical axis of the graph?
A) the quantity of output
B) the amount of crowding out
C) the interest rate
D) the price level
Correct Answer:
Verified
Q1: The marginal propensity to consume (MPC)is defined
Q3: The logic of the multiplier effect applies
A)only
Q16: Which of the following policy actions shifts
Q22: An increase in government spending initially and
Q37: Which of the following events shifts aggregate
Q199: If the multiplier is 5, then the
Q202: Scenario 16-1. Take the following information as
Q203: Figure 16-5. On the figure, MS represents
Q205: Scenario 16-1. Take the following information as
Q208: In a certain economy, when income is
Unlock this Answer For Free Now!
View this answer and more for free by performing one of the following actions

Scan the QR code to install the App and get 2 free unlocks

Unlock quizzes for free by uploading documents