Figure 16-5. On the figure, MS represents money supply and MD represents money demand.
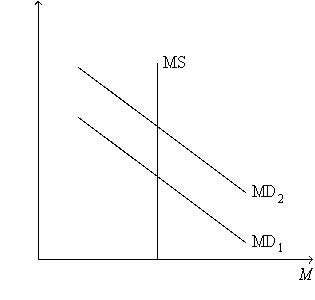
-Refer to Figure 16-5. A shift of the money-demand curve from MD1 to MD2 could be a result of
A) a decrease in taxes.
B) an increase in government spending.
C) an increase in the price level.
D) All of the above are correct.
Correct Answer:
Verified
Q8: Suppose an economy's marginal propensity to consume
Q28: Which of the following tends to make
Q36: Suppose the multiplier has a value that
Q171: Which of the following correctly explains the
Q212: In order to simplify the equation for
Q213: Figure 16-6. On the left-hand graph, MS
Q214: Scenario 16-1. Take the following information as
Q219: Figure 16-6. On the left-hand graph, MS
Q220: Figure 16-6. On the left-hand graph, MS
Q237: Suppose there are both multiplier and crowding
Unlock this Answer For Free Now!
View this answer and more for free by performing one of the following actions

Scan the QR code to install the App and get 2 free unlocks

Unlock quizzes for free by uploading documents