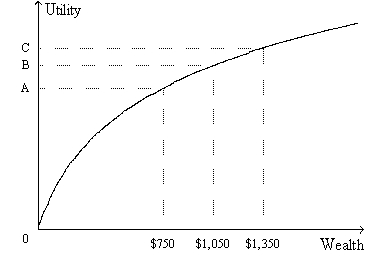
Figure 9-2. The figure shows a utility function for Mary Ann.

-Refer to Figure 9-2. Suppose the vertical distance between the points (0, A) and (0, B) is 5. If her wealth increased from $1,050 to $1,350, then
A) Mary Ann's subjective measure of her well-being would increase by less than 5 units.
B) Mary Ann's subjective measure of her well-being would increase by more than 5 units.
C) Mary Ann would change from being a risk-averse person into a person who is not risk averse.
D) Mary Ann would change from being a person who is not risk averse into a risk-averse person.
Correct Answer:
Verified
Q16: Economists have developed models of risk aversion
Q23: From the standpoint of the economy as
Q40: As the number of stocks in a
Q198: Figure 9-2. The figure shows a utility
Q199: The present value of a future payment
Q200: Figure 9-1. The figure shows a utility
Q201: Figure 9-3. The figure shows a utility
Q203: Figure 9-4. The figure shows a utility
Q205: Figure 9-4. The figure shows a utility
Q206: Figure 9-4. The figure shows a utility
Unlock this Answer For Free Now!
View this answer and more for free by performing one of the following actions

Scan the QR code to install the App and get 2 free unlocks

Unlock quizzes for free by uploading documents