Figure 8-2. The figure depicts a supply-of-loanable-funds curve and two demand-for-loanable-funds curves.
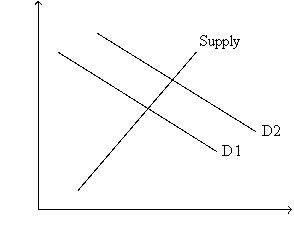
-Refer to Figure 8-2. What is measured along the horizontal axis of the graph?
A) the quantity of loanable funds
B) the size of the government budget deficit or surplus
C) the real interest rate
D) the nominal interest rate
Correct Answer:
Verified
Q91: A policy that induces people to save
Q93: Which of the following counts as part
Q95: According to the loanable funds model,which of
Q97: In the market for loanable funds,the interaction
Q98: Which of the following is included in
Q100: Which of the following is correct?
A)In a
Q114: Which of the following are effects of
Q367: Figure 8-1. The figure depicts a demand-for-loanable-funds
Q368: Figure 8-3. The figure shows two demand-for-loanable-funds
Q385: If the budget deficit increases then
A) saving
Unlock this Answer For Free Now!
View this answer and more for free by performing one of the following actions

Scan the QR code to install the App and get 2 free unlocks

Unlock quizzes for free by uploading documents