Figure 8-3. The figure shows two demand-for-loanable-funds curves and two supply-of-loanable-funds curves.
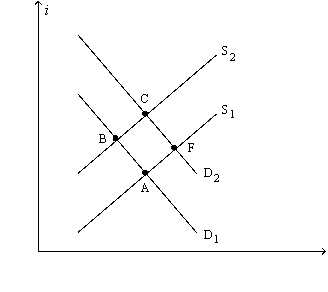
-Refer to Figure 8-3. A shift of the supply curve from S1 to S2 is called
A) an increase in the supply of loanable funds.
B) an increase in the quantity of loanable funds supplied.
C) a decrease in the supply of loanable funds.
D) a decrease in the quantity of loanable funds supplied.
Correct Answer:
Verified
Q69: Suppose the government ran a budget surplus
Q82: Which of the following statements is not
Q88: A government budget deficit affects the supply
Q90: The source of the supply of loanable
Q94: If the government instituted an investment tax
Q96: Which of the following events could explain
Q207: Suppose the government changed the tax laws,
Q363: Figure 8-2. The figure depicts a supply-of-loanable-funds
Q365: Figure 8-1. The figure depicts a demand-for-loanable-funds
Q366: Figure 8-3. The figure shows two demand-for-loanable-funds
Unlock this Answer For Free Now!
View this answer and more for free by performing one of the following actions

Scan the QR code to install the App and get 2 free unlocks

Unlock quizzes for free by uploading documents