Figure 8-3. The figure shows two demand-for-loanable-funds curves and two supply-of-loanable-funds curves.
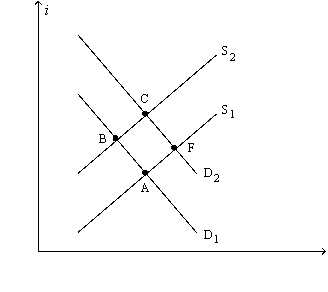
-Refer to Figure 8-3. Which of the following movements shows the effects of the government going from a budget deficit to a budget surplus?
A) a movement from Point A to Point B
B) a movement from Point B to Point A
C) a movement from Point A to Point F
D) a movement from Point C to Point B
Correct Answer:
Verified
Q91: A policy that induces people to save
Q95: According to the loanable funds model,which of
Q100: Which of the following is correct?
A)In a
Q121: For an imaginary economy,when the real interest
Q122: If the quantity of loanable funds demanded
Q138: The slope of the supply of loanable
Q378: Figure 8-3. The figure shows two demand-for-loanable-funds
Q379: Figure 8-3. The figure shows two demand-for-loanable-funds
Q381: Figure 8-4. On the horizontal axis of
Q383: Figure 8-4. On the horizontal axis of
Unlock this Answer For Free Now!
View this answer and more for free by performing one of the following actions

Scan the QR code to install the App and get 2 free unlocks

Unlock quizzes for free by uploading documents