Use the following to answer the question below.
The time series graph below shows monthly sales figures for a specialty gift item sold on the Home Shopping Network (HSN) . 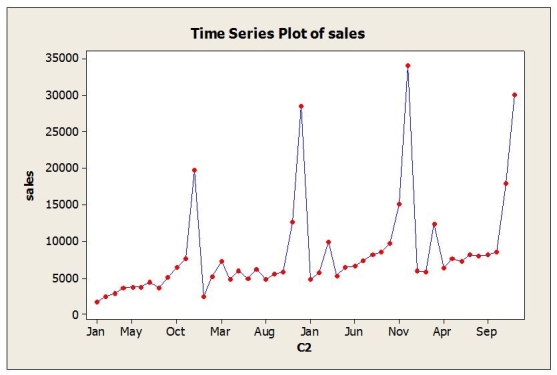
-The dominant time series component in these data is
A) Cyclical
B) Seasonal
C) Randomness
D) Irregular
E) Error
Correct Answer:
Verified
Q4: Use the following to answer the question(s)
Q6: Use the following to answer the question(s)
Q7: Machine oil is used by clothing manufacturers
Q8: Use the following to answer the question(s)
Q9: Use the following to answer the question(s)
Q10: Use the following to answer the question(s)
Q15: Use the following to answer the question(s)
Q17: By design, a required dimension on a
Q17: Use the following to answer the question(s)
Q18: Quarterly returns were forecasted for a mutual
Unlock this Answer For Free Now!
View this answer and more for free by performing one of the following actions

Scan the QR code to install the App and get 2 free unlocks

Unlock quizzes for free by uploading documents