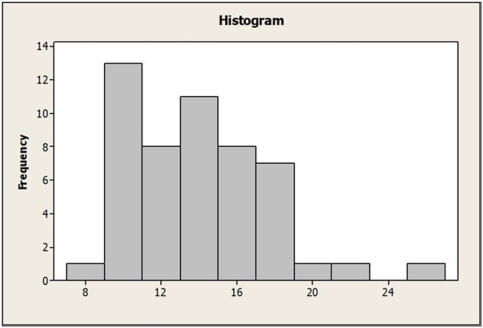
Use the following to answer the question(s) below.
Summary statistics and a histogram for certain data are shown below.


-What is the most appropriate measure to describe the centre of these data?
A) Range
B) Mean
C) Standard Deviation
D) Median
E) IQR
Correct Answer:
Verified
Q1: Which is true of the data shown
Q2: Use the following to answer the question(s)
Q3: Use the following to answer the question(s)
Q4: Use the following to answer the question(s)
Q5: A researcher is conducting a study on
Q7: What type of variable is the style
Q8: Use the following to answer the question(s)
Q9: Use the following to answer the question(s)
Q10: Use the following to answer the question(s)
Q11: An office supply chain has stores in
Unlock this Answer For Free Now!
View this answer and more for free by performing one of the following actions

Scan the QR code to install the App and get 2 free unlocks

Unlock quizzes for free by uploading documents