Daily closing stock prices for Kyocera Corporation were obtained from August 3, 2008 through August 23, 2008 and appear in the time series graph below. 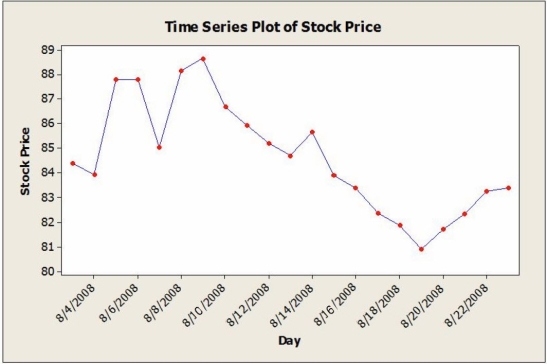 a. Identify the dominant time series component(s) in the data.
b. The method of moving averages was applied to these data. Below are time series graphs showing moving average results using two different values of L. In which application is a larger value of L used?
I. 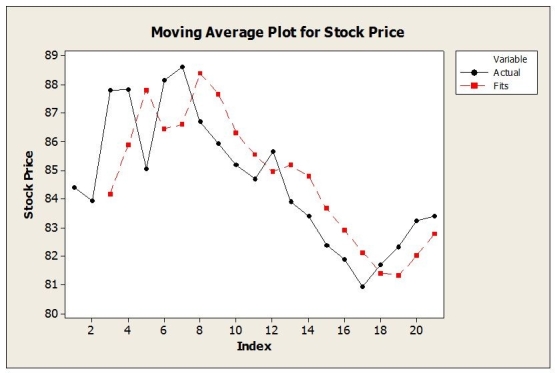 ii.
ii. 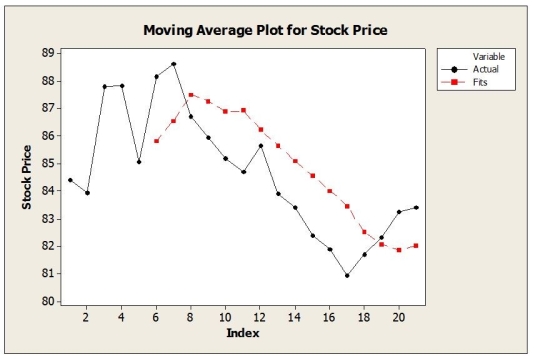 c. Suppose that the single exponential smoothing (SES) model was applied to these data. Below are time series graphs showing SES results using two different smoothing constants (α = 0.2 and α = 0.8). In which application is a larger value of α used?
I. 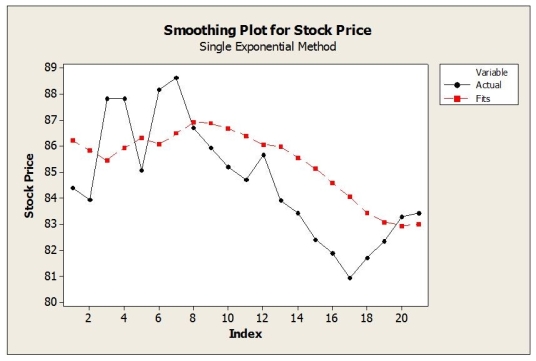 ii.
ii. 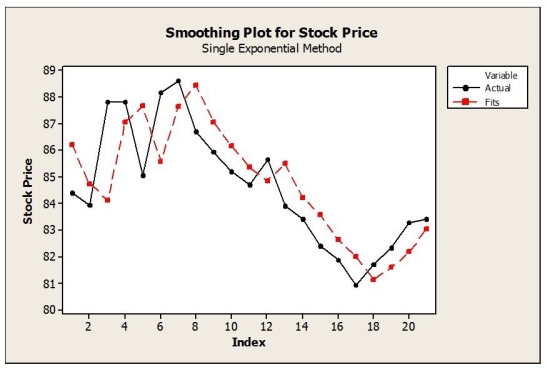
Correct Answer:
Verified
View Answer
Unlock this answer now
Get Access to more Verified Answers free of charge
Q5: A large automobile parts supplier, keeps track
Q6: Monthly closing stock prices, adjusted for dividends,
Q7: Consider the following to answer the question(s)
Q8: Quarterly sales data (in $10,000) for a
Q9: The following table shows actual sales values
Q11: Annual estimates of the population in a
Q12: A large automobile parts supplier keeps track
Q13: Consider the following to answer the question(s)
Q14: Consider the following to answer the question(s)
Q15: Annual estimates of the population in the
Unlock this Answer For Free Now!
View this answer and more for free by performing one of the following actions

Scan the QR code to install the App and get 2 free unlocks

Unlock quizzes for free by uploading documents