Consider the following to answer the question(s) below:
The quarterly sales of all types of bicycles sold at a small sporting goods store in Charlottetown for the 16 quarters from January 2005 to December 2008 are depicted in the time series graph below. 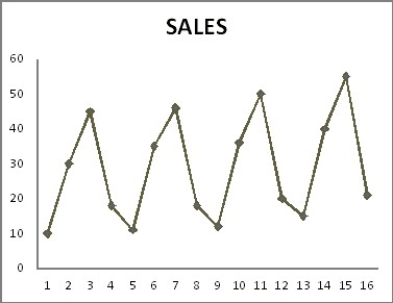

-Which of the following statements best describes this data and model?
A) The seasonal component is the most dominant.
B) All of the coefficients are significant for α = 0.05.
C) The model is additive.
D) The regression models both trend and seasonal components.
E) All of the above statements are correct.
Correct Answer:
Verified
Q18: Consider the following to answer the question(s)
Q19: Consider the following to answer the question(s)
Q20: Consider the following to answer the question(s)
Q22: A company has recorded annual sales for
Q22: Consider the following to answer the question(s)
Q24: Consider the following to answer the question(s)
Q25: Consider the following to answer the question(s)
Q25: If you suspect that your trend forecasting
Q27: Consider the following to answer the question(s)
Q28: Which of the following statistical measures is(are)
Unlock this Answer For Free Now!
View this answer and more for free by performing one of the following actions

Scan the QR code to install the App and get 2 free unlocks

Unlock quizzes for free by uploading documents