Consider the following to answer the question(s) below:
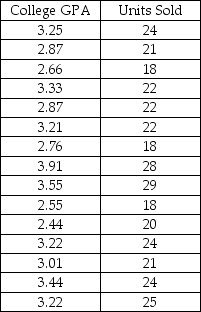
A sales manager was interested in determining if there is a relationship between college GPA and sales performance among salespeople hired within the last year. A sample of recently hired salespeople was selected and the number of units each sold last month was recorded. Relevant data appear in the table below.
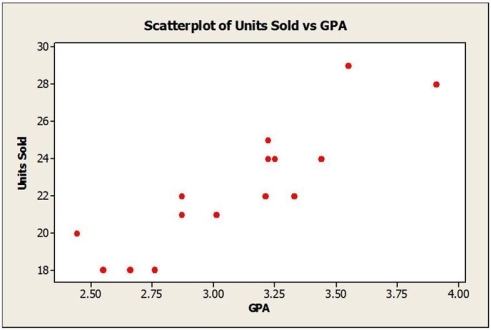
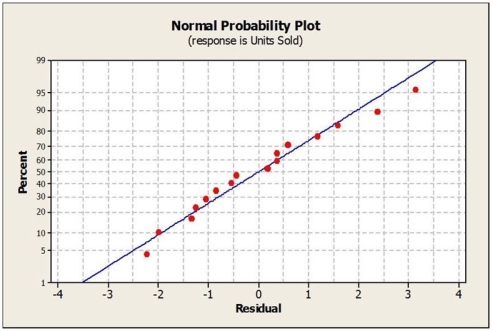
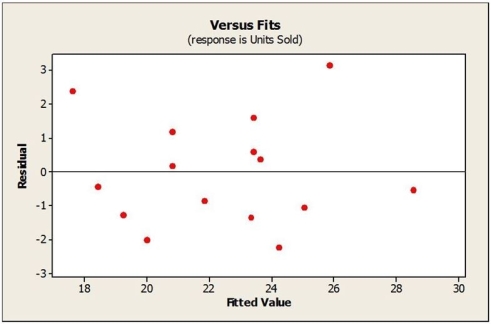
 Below are the scatterplot, regression results, and residual plots for these data.
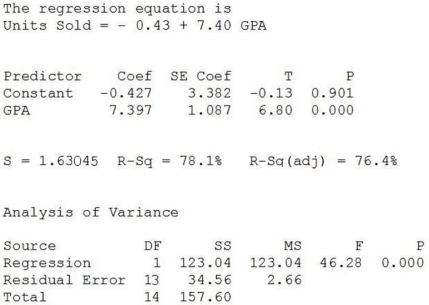
-The confidence interval and prediction interval for the number of units sold per month when GPA = 3.00 are shown below. Interpret both intervals in this context.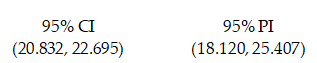
Correct Answer:
Verified
View Answer
Unlock this answer now
Get Access to more Verified Answers free of charge
Q1: Consider the following to answer the question(s)
Q2: Consider the following to answer the question(s)
Q3: Consider the following to answer the question(s)
Q4: Consider the following to answer the question(s)
Q8: Consider the following to answer the question(s)
Q9: Consider the following to answer the question(s)
Q10: Consider the following to answer the question(s)
Q10: Consider the following to answer the question(s)
Q11: Consider the following to answer the question(s)
Q18: Consider the following to answer the question(s)
Unlock this Answer For Free Now!
View this answer and more for free by performing one of the following actions

Scan the QR code to install the App and get 2 free unlocks

Unlock quizzes for free by uploading documents