Below is a time series graph for monthly closing stock prices of 3M Dental Products. Which of the following statements is true? 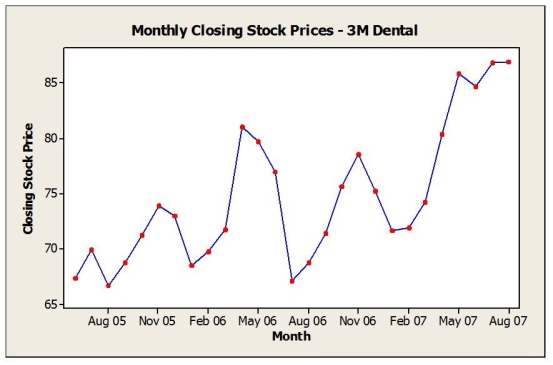
A) The data are stationary.
B) The data show an upward trend.
C) A histogram would provide a good representation of these data.
D) The data show a downward trend.
E) A boxplot would provide a good representation of this data.
Correct Answer:
Verified
Q21: Consider the following to answer the question(s)
Q22: The asking price for homes on the
Q23: The advantage of using the interquartile range
Q24: The asking price for homes in the
Q25: Which of the following best describes the
Q26: Consider the following to answer the question(s)
Q27: Consider the following to answer the question(s)
Q28: A sample of families with children at
Q29: Sample data were collected on the number
Q30: Consider the following to answer the question(s)
Unlock this Answer For Free Now!
View this answer and more for free by performing one of the following actions

Scan the QR code to install the App and get 2 free unlocks

Unlock quizzes for free by uploading documents