Figure 26-3. The figure shows two demand-for-loanable-funds curves and two supply-of-loanable-funds curves. 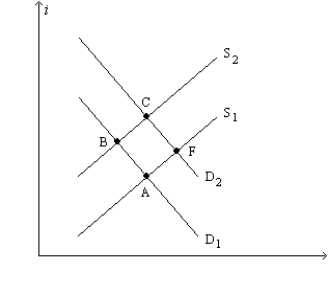
-Refer to Figure 26-3. A shift of the supply curve from S1 to S2 is called
A) an increase in the supply of loanable funds.
B) an increase in the quantity of loanable funds supplied.
C) a decrease in the supply of loanable funds.
D) a decrease in the quantity of loanable funds supplied.
Correct Answer:
Verified
Q63: Suppose a country had a smaller increase
Q73: When the government runs a budget deficit,
A)interest
Q90: The source of the supply of loanable
Q91: A policy that induces people to save
Q97: In the market for loanable funds,the interaction
Q100: Which of the following is correct?
A)In a
Q102: Figure 26-2.The figure depicts a supply-of-loanable-funds curve
Q107: Figure 26-1.The figure depicts a demand-for-loanable-funds curve
Q207: Suppose the government changed the tax laws,
Q385: If the budget deficit increases then
A) saving
Unlock this Answer For Free Now!
View this answer and more for free by performing one of the following actions

Scan the QR code to install the App and get 2 free unlocks

Unlock quizzes for free by uploading documents