Figure 26-4. On the horizontal axis of the graph, L represents the quantity of loanable funds in billions of dollars. 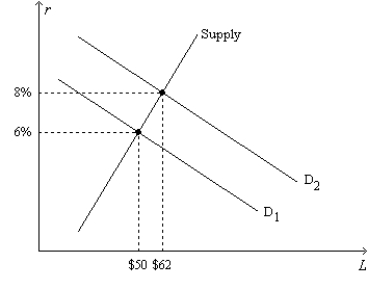
-Refer to Figure 26-4. Regard the position of the Supply curve as fixed, as on the graph. If the real interest rate is 4 percent, the inflation rate is 2 percent, and the market for loanable funds is in equilibrium, then the position of the demand-for-loanable-funds curve must be
A) D1.
B) D2.
C) between D1 and D2.
D) to the left of D1.
Correct Answer:
Verified
Q94: If the government instituted an investment tax
Q95: According to the loanable funds model,which of
Q108: Figure 26-3.The figure shows two demand-for-loanable-funds curves
Q120: For an imaginary economy,when the real interest
Q121: For an imaginary economy,when the real interest
Q128: When the government goes from running a
Q136: For an imaginary economy,when the real interest
Q140: As real interest rates fall,firms desire to
A)buy
Q399: Figure 26-3. The figure shows two demand-for-loanable-funds
Q407: Figure 26-4. On the horizontal axis of
Unlock this Answer For Free Now!
View this answer and more for free by performing one of the following actions

Scan the QR code to install the App and get 2 free unlocks

Unlock quizzes for free by uploading documents