Figure 30-3. On the graph, MS represents the money supply and MD represents money demand. The usual quantities are measured along the axes. 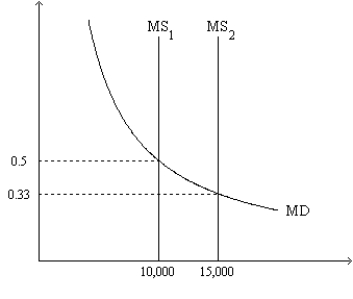
-Refer to Figure 30-3. If the relevant money-supply curve is the one labeled MS2, then
A) when the money market is in equilibrium, one dollar purchases about one-third of a basket of goods and services.
B) when the money market is in equilibrium, one unit of goods and services sells for 33 cents.
C) there is an excess demand for money if the value of money in terms of goods and services is 0.5.
D) All of the above are correct.
Correct Answer:
Verified
Q82: Economic variables whose values are measured in
Q102: On its web site,your bank posts the
Q105: You find that to attract a sufficient
Q113: Figure 30-1 Q114: Figure 30-2. On the graph, MS represents Q115: Figure 30-3. On the graph, MS represents![]()

