Figure 34-6. On the left-hand graph, MS represents the supply of money and MD represents the demand for money; on the right-hand graph, AD represents aggregate demand. The usual quantities are measured along the axes of both graphs.
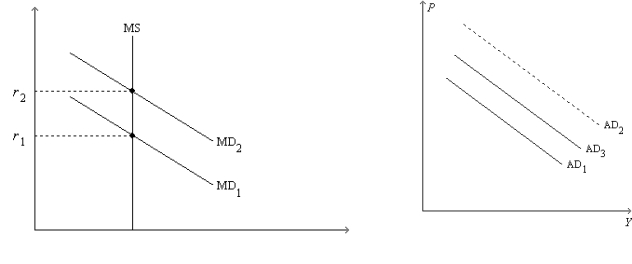
-Refer to Figure 34-6. Suppose the graphs are drawn to show the effects of an increase in government purchases. If it were not for the increase in r from r1 to r2, then
A) there would be no crowding out.
B) the full multiplier effect of the increase in government purchases would be realized.
C) the AD curves that actually apply, before and after the change in government purchases, would be separated horizontally by the distance equal to the multiplier times the change in government purchases.
D) All of the above are correct.
Correct Answer:
Verified
Q22: An increase in government spending initially and
Q32: The multiplier effect is exemplified by the
Q33: A decrease in government spending initially and
Q36: Suppose the multiplier has a value that
Q45: The term crowding-out effect refers to
A)the reduction
Q57: The change in aggregate demand that results
Q175: The government builds a new water-treatment plant.
Q176: Which of the following is an example
Q239: Suppose an economy's marginal propensity to consume
Q240: Figure 34-5. On the figure, MS represents
Unlock this Answer For Free Now!
View this answer and more for free by performing one of the following actions

Scan the QR code to install the App and get 2 free unlocks

Unlock quizzes for free by uploading documents