Figure 35-1 
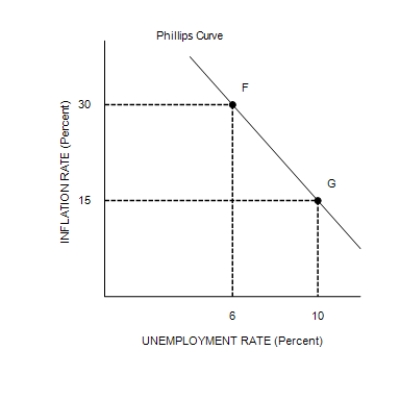
-Refer to Figure 35-1. Assuming the price level in the previous year was 100, point F on the right-hand graph corresponds to
A) point A on the left-hand graph.
B) point B on the left-hand graph.
C) point C on the left-hand graph.
D) point D on the left-hand graph.
Correct Answer:
Verified
Q133: In 2009, Congress and President Obama approved
Q134: Figure 35-1 Q135: According to the Phillips curve, policymakers would Q136: Suppose that the money supply increases. In Q137: If the government decreases government expenditures, then Q139: Other things constant, which of the following Q140: Samuelson and Solow reasoned that when aggregate Q141: According to the long-run Phillips curve, in Q142: Which of the following would reduce the Q143: Suppose Americans become pessimistic about the future![]()
Unlock this Answer For Free Now!
View this answer and more for free by performing one of the following actions

Scan the QR code to install the App and get 2 free unlocks

Unlock quizzes for free by uploading documents