Use the following to answer the question below.
The time series graph below shows monthly sales figures for a specialty gift item sold on the Home Shopping Network (HSN) . 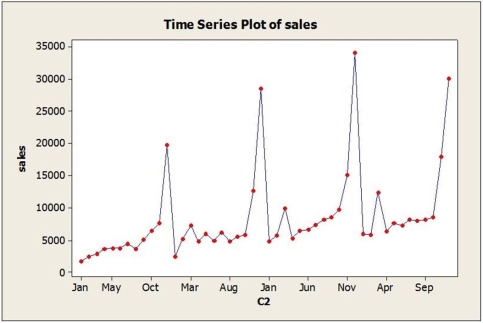
-The dominant time series component in these data is
A) cyclical.
B) seasonal.
C) random walk.
D) irregular.
E) index numbers.
Correct Answer:
Verified
Q11: Use the following to answer the question(s)
Q12: Machine oil is used by clothing manufacturers
Q13: Use the following to answer the question(s)
Q14: Use the following to answer the question(s)
Q15: A producer of specialty products uses a
Q17: By design, a required dimension on a
Q18: Quarterly returns were forecasted for a mutual
Q19: Use the following to answer the question(s)
Q20: Use the following to answer the question(s)
Q21: A producer of specialty products uses a
Unlock this Answer For Free Now!
View this answer and more for free by performing one of the following actions

Scan the QR code to install the App and get 2 free unlocks

Unlock quizzes for free by uploading documents