Use the following to answer the question(s) below.
The time series graph below shows annual sales figures (in thousands of dollars) for a well known department store chain. 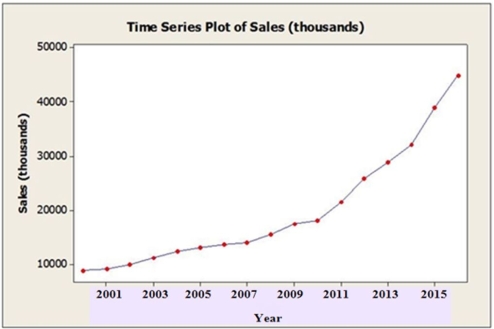
-Which model would be most appropriate for forecasting this series?
A) Moving Average using L = 3
B) Single Exponential Smoothing with α = 0.1
C) Quadratic Trend
D) Linear Trend
E) Seasonal Regression
Correct Answer:
Verified
Q4: Use the following to answer the question(s)
Q5: Use the following to answer the question(s)
Q6: Use the following to answer the question(s)
Q7: Machine oil is used by clothing manufacturers
Q8: Use the following to answer the question(s)
Q10: The standard deviations (in thousands of dollars)
Q11: Use the following to answer the question(s)
Q12: Machine oil is used by clothing manufacturers
Q13: Use the following to answer the question(s)
Q14: Use the following to answer the question(s)
Unlock this Answer For Free Now!
View this answer and more for free by performing one of the following actions

Scan the QR code to install the App and get 2 free unlocks

Unlock quizzes for free by uploading documents