Use the following to answer the question(s) below.
Weekly commodity prices for heating oil (in cents) were obtained and regressed against time. Below is the regression output and residual plots from fitting a linear model. 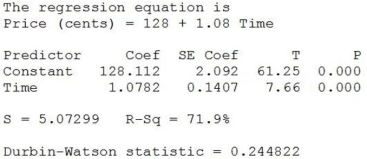
-Based on the output and plots, which of the following statements is not true?
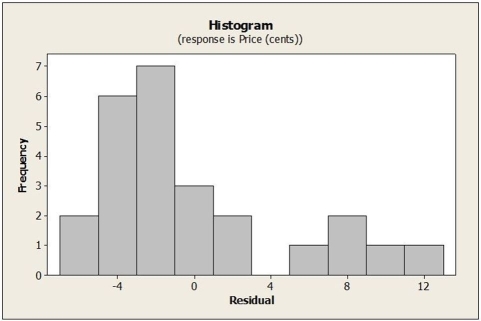
A) The t-test for the regression slope indicates that it is significantly different from zero. However, histogram shows that the distribution is skewed to the right.
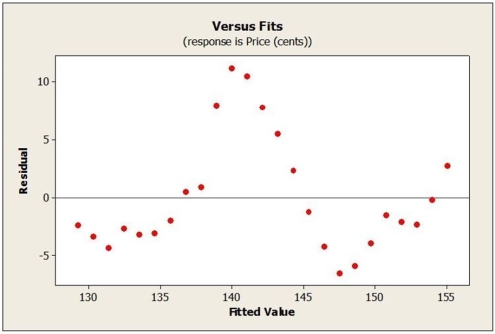
B) According to the regression output, the model explains 71.9% of the variability in heating oil prices. However, the residual plot shows a clear pattern and curvature.
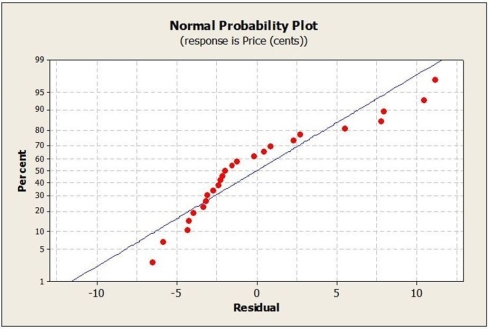
C) The normal probability plot shows some bend and indicates that we probably cannot proceed with regression inference.
D) The residual plot suggests that the Independence assumption might be violated.
E) The histogram and plots show that all assumptions and conditions for regression inference are met.
Correct Answer:
Verified
Q10: Use the following to answer the question(s)
Q11: Use the following to answer the question(s)
Q12: The residual plot for a linear regression
Q13: Use the following to answer the question(s)
Q14: Use the following to answer the question(s)
Q16: The Durbin-Watson statistic indicates
A) that there is
Q17: Use the following to answer the question(s)
Q18: Use the following to answer the question(s)
Q19: Use the following to answer the question(s)
Q20: The model ![]()
Unlock this Answer For Free Now!
View this answer and more for free by performing one of the following actions

Scan the QR code to install the App and get 2 free unlocks

Unlock quizzes for free by uploading documents