The following plot is the best for checking 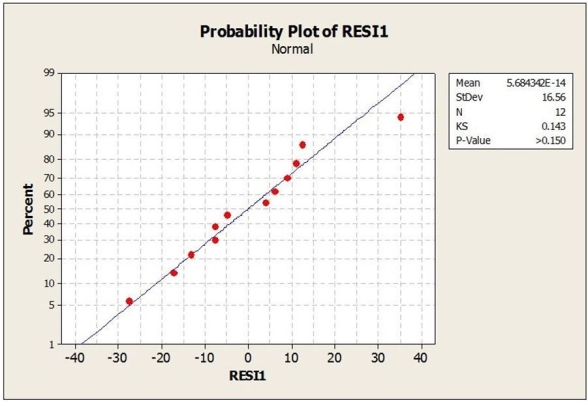
A) Equal Variance Assumption.
B) Linearity Assumption.
C) Nearly Normal Condition.
D) Non-linear Condition.
E) Dependence Condition.
Correct Answer:
Verified
Q24: Based on the scatterplot shown below, what
Q25: Use the following to answer the question(s)
Q26: Use the following to answer the question(s)
Q27: Use the following to answer the question(s)
Q28: Use the following to answer the question(s)
Q30: Use the following to answer the question(s)
Q31: Suppose that 6 economists who work for
Q32: Suppose that ten new smart phone models
Q33: A telecommunications company is interested in determining
Q34: Suppose that 6 economists who work for
Unlock this Answer For Free Now!
View this answer and more for free by performing one of the following actions

Scan the QR code to install the App and get 2 free unlocks

Unlock quizzes for free by uploading documents