Below is the plot of residuals versus predicted values for this estimated multiple regression model. What does the residual plot suggest? 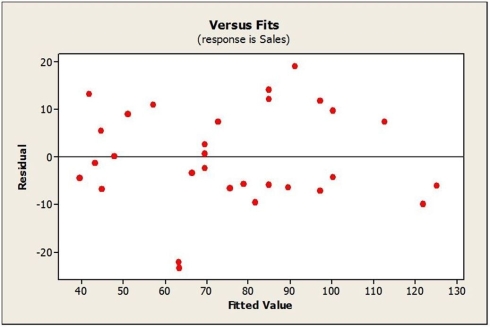
A) The Linearity condition is not satisfied.
B) There is an extreme departure from normality.
C) The variance changes a lot.
D) There are a couple of possible outliers.
E) The plot thickens from left to right.
Correct Answer:
Verified
Q12: Consider the following to answer the question(s)
Q13: Consider the following to answer the question(s)
Q14: In determining the best companies to work
Q15: Consider the following to answer the question(s)
Q16: Consider the following to answer the question(s)
Q17: Consider the following to answer the question(s)
Q19: Consider the following to answer the question(s)
Q20: Consider the following to answer the question(s)
Q21: Consider the following to answer the question(s)
Q22: Consider the following to answer the question(s)
Unlock this Answer For Free Now!
View this answer and more for free by performing one of the following actions

Scan the QR code to install the App and get 2 free unlocks

Unlock quizzes for free by uploading documents