A food company launches an advertising campaign for a high fibre cereal and wants to claim that high fibre cereals are lower in calories. In order to research this claim, they obtain nutritional information for 34 breakfast cereals including the amount of fibre (in grams) and the number of calories per serving. The data resulted in the following scatterplot. 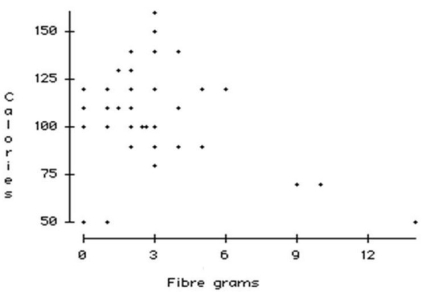 a. Do you think there is a clear pattern? Describe the association between fibre and calories.
b. Comment on any unusual data point or points in the data set. Explain.
c. Do you think a model could accurately predict the number of calories in a serving of cereal that has 22 grams of fibre? Explain.
Correct Answer:
Verified
View Answer
Unlock this answer now
Get Access to more Verified Answers free of charge
Q11: Consider the following to answer the question(s)
Q12: Quarterly figures for e-commerce retail sales were
Q13: A regression model was developed relating average
Q14: Consider the following to answer the question(s)
Q15: Data were collected for a sample of
Q17: Consider the following to answer the question(s)
Q18: Suppose that data on labour productivity and
Q19: Consider the following to answer the question(s)
Q20: Quarterly figures for e-commerce retail sales were
Q21: After transforming data, a model of retail
Unlock this Answer For Free Now!
View this answer and more for free by performing one of the following actions

Scan the QR code to install the App and get 2 free unlocks

Unlock quizzes for free by uploading documents