Consider the following to answer the question(s) below:
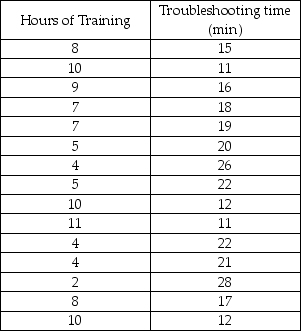
An operations manager was interested in determining if there is a relationship between the amount of training received by production line workers and the time it takes for them to troubleshoot a process problem. A sample of recently trained line workers was selected. The number of hours of training time received and the time it took (in minutes) for them to troubleshoot their last process problem were captured. Relevant data appear in the table below.
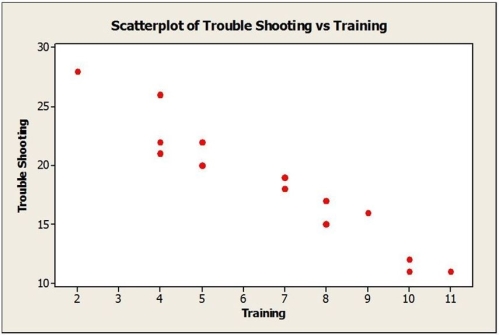
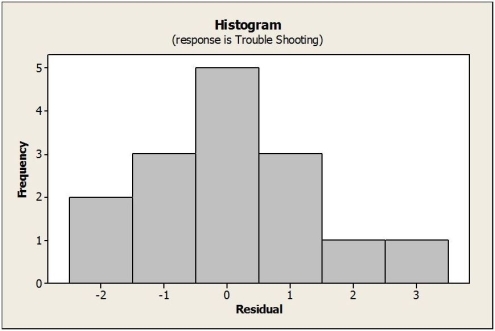
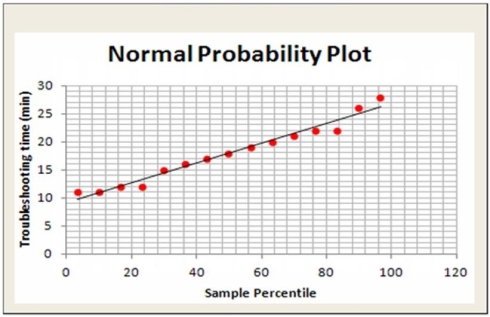
 Below are the scatterplot, regression results, and residual plots for these data.
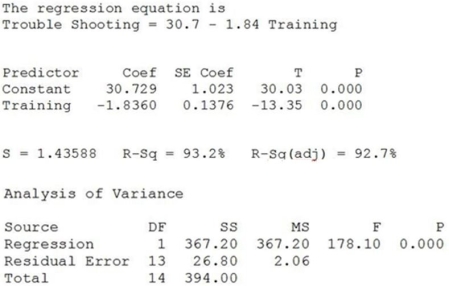

-The confidence interval and prediction interval for troubleshooting time with 8 hours of training are shown below. Interpret both intervals in this context.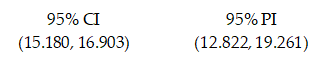
Correct Answer:
Verified
Q1: Consider the following to answer the question(s)
Q2: Consider the following to answer the question(s)
Q4: Consider the following to answer the question(s)
Q6: Consider the following to answer the question(s)
Q8: Consider the following to answer the question(s)
Q9: Consider the following to answer the question(s)
Q10: Consider the following to answer the question(s)
Q10: Consider the following to answer the question(s)
Q11: Consider the following to answer the question(s)
Q18: Consider the following to answer the question(s)
Unlock this Answer For Free Now!
View this answer and more for free by performing one of the following actions

Scan the QR code to install the App and get 2 free unlocks

Unlock quizzes for free by uploading documents