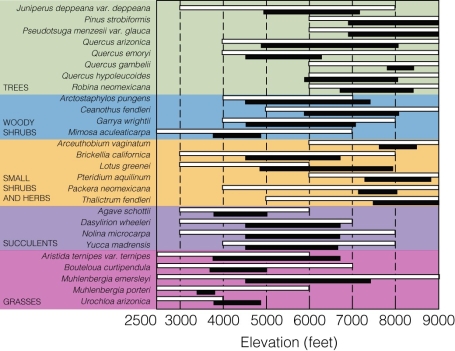
 What does this figure indicate?
A) Species abundances have dramatically declined.
B) Species richness has dramatically declined.
C) Species have moved higher in elevation over time.
D) Species have moved lower in elevation over time.
Correct Answer:
Verified
Q20: Differential changes in phenology can result in
Q21: Q22: Warming is predicted to be greatest Q23: Q24: During the last 40 years,warmer-water plankton have Q26: The Network of Ecosystem Warming Studies provides Q27: Due to global warming what occurred in Q28: How are the majority tree species responding Q29: What is a GCM? Q30: Plant species in California's Santa Rosa Mountains![]()
A)during winter![]()
A)general climate model
B)geographic climate
Unlock this Answer For Free Now!
View this answer and more for free by performing one of the following actions

Scan the QR code to install the App and get 2 free unlocks

Unlock quizzes for free by uploading documents