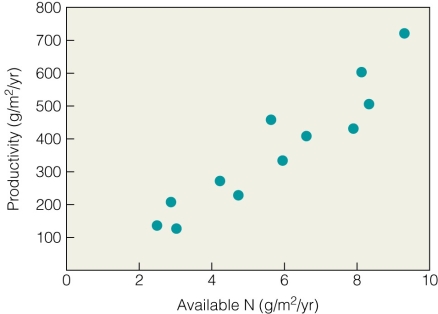
 Figure 1.5 represents which type of plot?
A) Random
B) Scatter
C) Linear
D) Factorial
Correct Answer:
Verified
Q21: Q22: Science can best be described as Q23: An ecologist conducts a greenhouse experiment to Q24: An integrated set of hypotheses that together Q25: A model is used by ecologists to Q27: Which model would you use to examine Q28: A hypothesis refers to a(n) Q29: Why is ecology considered an interdisciplinary science? Q30: Which of the following represents the correct Q31: Broad scale regions dominated by similar types![]()
A)a search
A)prove
A)phenomenon that is
A)It
Unlock this Answer For Free Now!
View this answer and more for free by performing one of the following actions

Scan the QR code to install the App and get 2 free unlocks

Unlock quizzes for free by uploading documents