-The line chart below shows cucumber prices fluctuated from $2.00 per pound to over $4.50 per pound during the year. 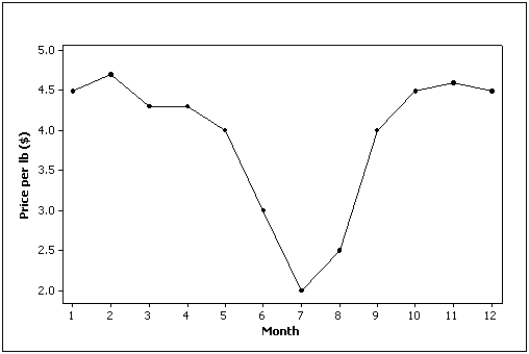
Correct Answer:
Verified
Q1: Experience shows that few students hand in
Q5: The number of class intervals in a
Q7: Correlation implies causation.
Q17: A histogram represents interval data.
Q42: Data for calories and salt content (milligrams
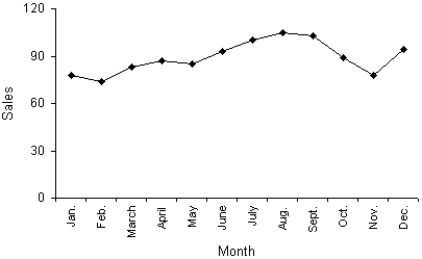
Q44: The graph below represents a line graph.
Q47: The scatter diagram below depicts data with
Q55: A line chart is created by plotting
Q88: The sum of relative frequencies in a
Q88: The two most important characteristics revealed by
Unlock this Answer For Free Now!
View this answer and more for free by performing one of the following actions

Scan the QR code to install the App and get 2 free unlocks

Unlock quizzes for free by uploading documents