What type of graph depicts the data below? 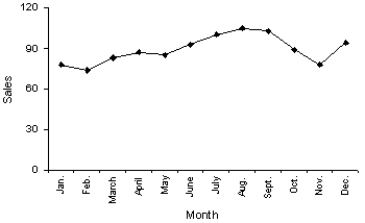
A) A line chart
B) A histogram
C) A dot plot
D) A bar chart
Correct Answer:
Verified
Q24: Which of the following statements about shapes
Q31: A modal class in a histogram is
Q32: The sum of the relative frequencies for
Q76: Which of the following statements describes a
Q80: Which of the following represents time-series data?
A)The
Q87: Compare the two histograms below. Which statement
Q87: In order to draw a scatter diagram,we
Q88: Compare the spread of the two histograms
Q95: The relationship between two interval variables is
Q99: Which of the following statements is false?
A)You
Unlock this Answer For Free Now!
View this answer and more for free by performing one of the following actions

Scan the QR code to install the App and get 2 free unlocks

Unlock quizzes for free by uploading documents