The following figures represent distributions of gas molecules between two containers connected by an open tube.Which one represents the configuration with the largest number of equivalent microstates (most ways of achieving it) ?
A) 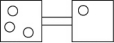
B) 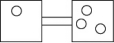
C) 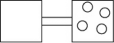
D) 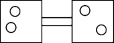
E) 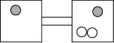
Correct Answer:
Verified
Q3: When the volume of a gas is
Q9: The entropy change in a system
Q12: The following figures represent distributions of gas
Q13: Which of the following is a driving
Q13: Which of the following statements is a
Q14: What modes of motion does a molecule
Q14: Which of the following states of motion
Q17: The following figures represent distributions of two
Q18: Given one mole of each of the
Q31: At 0 K, the entropy of a
Unlock this Answer For Free Now!
View this answer and more for free by performing one of the following actions

Scan the QR code to install the App and get 2 free unlocks

Unlock quizzes for free by uploading documents