Multiple Choice
Which of the following graphs shows how the density of an ideal gas changes with temperature?
A) 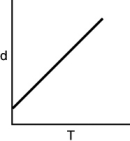
B) 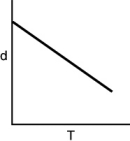
C) 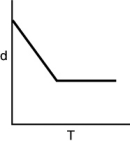
D) 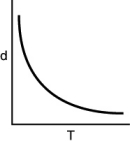
E) none of these
Correct Answer:
Verified
Related Questions
Q26: A 1.50 mol sample of He occupies
Q35: What is the pressure of a 3.5
Q71: Indicate the gas with the greatest density
Q72: What is the molar volume of
Q82: Which of the gas samples shown below
Q82: Hydrogen cyanide gas (HCN, 27.03 g/mol)
Q84: Suppose a 3.00 L scuba tank
Q89: In an experiment, hydrogen sulfide gas
Q89: What is the temperature if 5.00
Q100: How many moles of propane are
Unlock this Answer For Free Now!
View this answer and more for free by performing one of the following actions

Scan the QR code to install the App and get 2 free unlocks

Unlock quizzes for free by uploading documents