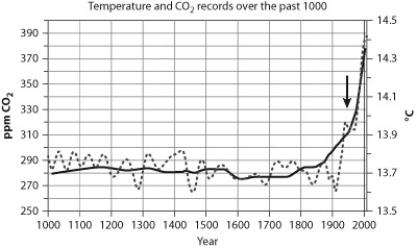
 The graph shows records of temperature (light gray line) and CO2 (dark gray line) over the past 1,000 years. CO2 is recorded in parts per million (ppm) .
-If you focus on the data from the mid-1900s (indicated by the arrow) through today, the graph shows that
A) there is a correlation between CO2 and temperature; when CO2 levels are high, so is temperature.
B) there is a correlation between CO2 and temperature; when CO2 levels are high, temperature is low.
C) there is no correlation between CO2 and temperature; CO2 fluctuates randomly and temperature is constant.
D) there is no correlation between CO2 and temperature; CO2 is constant and temperature fluctuates randomly.
Correct Answer:
Verified
Q56: The electrons lost from the reaction center
Q57: Photosynthetic organisms derive their carbon from
A) carbon
Q58: Photophosphorylation during photosynthesis differs from oxidative phosphorylation
Q59: Plant cells
A) lack mitochondria and chloroplasts.
B) lack
Q60: The Calvin cycle constructs _, an energy-rich
Q62: Which of the following best describes the
Q63: It has been suggested that scientists mimic
Q64: Which of the following is not an
Q65: Which of the following is the best
Q66: It has been suggested that scientists should
Unlock this Answer For Free Now!
View this answer and more for free by performing one of the following actions

Scan the QR code to install the App and get 2 free unlocks

Unlock quizzes for free by uploading documents