According to this graph of changes in Earth's atmosphere, which change took place between the years 1800 and 2000? 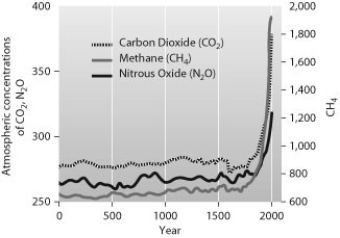
A) Nitrous oxide (N2O) levels increased from 270 ppb to 390 ppb.
B) Carbon dioxide (CO2) levels increased from 950 ppb to 1,800 ppb.
C) Carbon dioxide (CO2) levels increased from 290 ppm to 380 ppm.
D) Methane (CH4) levels increased from 270 ppm to almost 2,000 ppm.
Correct Answer:
Verified
Q41: You are a climate scientist who wants
Q42: According to this figure, which organisms have
Q43: As the climate warms, the population ranges
Q44: The International Union for the Conservation
Q45: The accompanying figure depicts natural fluctuation of
Q47: As the climate warms, the population ranges
Q48: While habitat destruction by humans creates fragmented
Q49: Suppose a species of wild boar (a
Q50: As global temperatures continue to rise, what
Q51: Based on the characteristics of the snakehead
Unlock this Answer For Free Now!
View this answer and more for free by performing one of the following actions

Scan the QR code to install the App and get 2 free unlocks

Unlock quizzes for free by uploading documents