Below is a figure from an experiment that was performed to measure the effect of carbonate ion (CO32-) concentration on the calcification (growth) rate of coral reefs. At which point on the graph is the ocean pH the lowest? 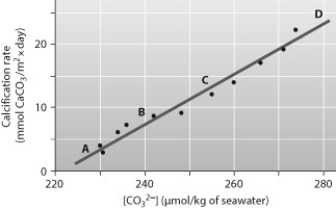
A) A
B) B
C) C
D) D
Correct Answer:
Verified
Q58: Household ammonia, or ammonium hydroxide, is a
Q59: Clots in our blood can lead to
Q60: How will a lower ocean pH caused
Q61: Uranium is a metallic element that is
Q62: If you were able to chemically analyze
Q64: You want to design an experiment to
Q65: You want to design a controlled experiment
Q66: You hypothesize that a tablet of PEPCID
Q67: Below is the structure of leucine, an
Q68: You've been experiencing acid indigestion lately, and
Unlock this Answer For Free Now!
View this answer and more for free by performing one of the following actions

Scan the QR code to install the App and get 2 free unlocks

Unlock quizzes for free by uploading documents