The data were collected from the heterocysts of a nitrogen-fixing cyanobacterium inhabiting equatorial ponds. Study the graph in Figure 24.3 and choose the most likely explanation for the shape of the curve. 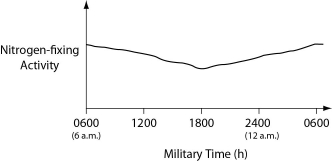 Figure 24.3
A) Enough O2 enters heterocysts during hours of peak photosynthesis to have a somewhat-inhibitory effect on nitrogen fixation.
B) Light-dependent reaction rates must be highest between 1800 hours and 0600 hours.
C) Atmospheric N2 levels increase at night because plants are no longer metabolizing this gas, so they are not absorbing this gas through their stomata.
D) Heterocyst walls become less permeable to N2 influx during darkness.
E) The amount of fixed nitrogen that is dissolved in the pond water in which the cyanobacteria are growing peaks at the close of the photosynthetic day (1800 hours) .
Correct Answer:
Verified
Q6: Mycoplasmas are bacteria that lack cell walls.
Q25: Broad-spectrum antibiotics inhibit the growth of most
Q31: The following questions refer to Figure 27.1.
In
Q34: If all prokaryotes on Earth suddenly vanished,
Q47: The following questions refer to Figure 27.1.
In
Q49: During which two times can the recipient
Q50: In a hypothetical situation, a bacterium lives
Q57: The following questions refer to Figure 27.1.
In
Q58: Figure 27.2 depicts changes to the amount
Q60: The following questions refer to Figure 27.1.
In
Unlock this Answer For Free Now!
View this answer and more for free by performing one of the following actions

Scan the QR code to install the App and get 2 free unlocks

Unlock quizzes for free by uploading documents