The next question(s) refer to Table 20.1, which compares the % sequence homology of four different parts (two introns and two exons) of a gene that is found in five different eukaryotic species. Each part is numbered to indicate its distance from the promoter (for example, intron I is the one closest to the promoter) . The data reported for species A were obtained by comparing DNA from one member of species A to the DNA of another member of species A. 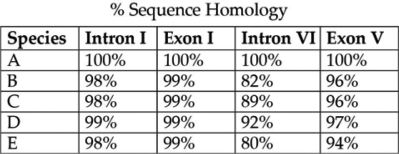 Table 20.1
-Based on the tabular data, and assuming that time advances vertically, which cladogram (a type of phylogenetic tree) is the most likely depiction of the evolutionary relationships among these five species?
A) 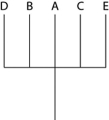
B) 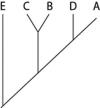
C) 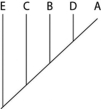
D) 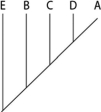
Correct Answer:
Verified
Q50: The next question(s) refer to Table 20.1,
Q54: The relative lengths of the frog and
Q55: A) that these organisms are phenotypically more
Q57: In figure shown below, which similarly inclusive
Q57: In a comparison of birds and mammals,
Q58: Please use the following information to answer
Unlock this Answer For Free Now!
View this answer and more for free by performing one of the following actions

Scan the QR code to install the App and get 2 free unlocks

Unlock quizzes for free by uploading documents