A sketch of the free energy for a hypothetical chemical equilibrium is shown here. What part of the plot on the axis representing the relative quantities of reactants and products corresponds to a value of Q that is less than K? 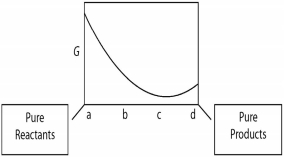
A) a to b
B) b to c
C) a to c
D) b to d
E) c to d
Correct Answer:
Verified
Q128: A sketch of the free energy
Q129: What is the value of the
Q130: As T approaches infinity, ln K approaches
Q131: The prediction of linearity in a
Q132: The equilibrium constant for a given reaction
Q134: As the temperature of an endothermic
Q135: When plotting ln K vs. 1/T,
Q136: Given the following two measurements of
Q137: What is the value of the
Q138: Which of the following relationships are
Unlock this Answer For Free Now!
View this answer and more for free by performing one of the following actions

Scan the QR code to install the App and get 2 free unlocks

Unlock quizzes for free by uploading documents