A cooling curve for some substance is shown below. Which of the line segments (I-V) represents the liquid-to-solid transition? 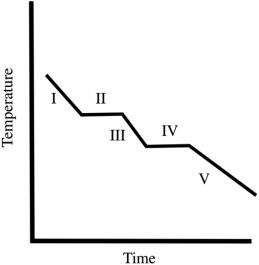
A) I
B) II
C) III
D) IV
E) V
Correct Answer:
Verified
Q39: According to the first law of thermodynamics,
Q40: Which of the following bar charts shows
Q41: A cooling curve for some substance is
Q42: The change in enthalpy and the change
Q43: Which statement A-D about the first
Q45: You heat a cup of coffee
Q46: Which statement below regarding the various heat
Q47: How much work does a gas do
Q48: The best definition of the enthalpy change
Q49: In a steam engine, steam in a
Unlock this Answer For Free Now!
View this answer and more for free by performing one of the following actions

Scan the QR code to install the App and get 2 free unlocks

Unlock quizzes for free by uploading documents