The figure below shows the hypsometric curve for the Earth.Which of the following can be concluded from the plot of this data? 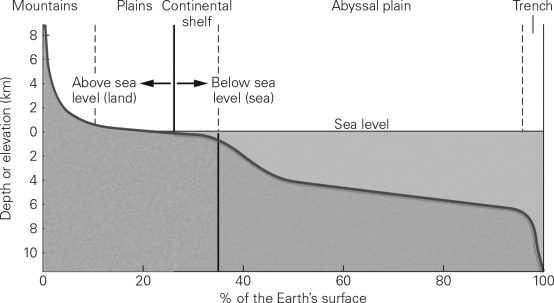
A) Regions of high elevation (> 4 km) are common on the Earth.
B) Most of the continents are between 0 and 1 km above sea level.
C) Elevations of -10 km to 8 km are nearly uniformly distributed across the Earth's surface.
D) Most of the seafloor is more than 6 km below sea level.
Correct Answer:
Verified
Q19: Look at the following image of our
Q20: The atmosphere is divided into several distinct
Q21: Most of the ocean floor is made
Q22: Which of the following is NOT an
Q23: During a journey to the center of
Q25: Molten material slowly cools and crystalizes underground.This
Q26: The density of rocks is generally related
Q27: The densest layer of the Earth is
Q28: Which of the following is most representative
Q29: Which of the following lists compositions in
Unlock this Answer For Free Now!
View this answer and more for free by performing one of the following actions

Scan the QR code to install the App and get 2 free unlocks

Unlock quizzes for free by uploading documents