Multiple Choice
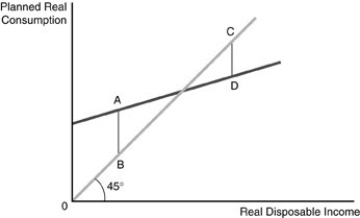
-Refer to the above figure. The figure represents the consumption function for a consumer. The distance between A and B represents
A) the amount of autonomous consumption.
B) the amount of autonomous saving.
C) the amount of total consumption.
D) none of the above.
Correct Answer:
Verified
Related Questions
Q138: Q139: What can we say about APC + Q140: All of the following shift the consumption Q141: Q142: Dissaving occurs when![]()
![]()
A) the amount of consumption

