Multiple Choice
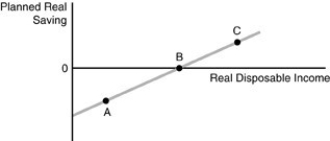
-Refer to the above figure. The figure represents the saving function for the consumer. Point C represents
A) the amount of autonomous consumption.
B) a situation in which saving is positive.
C) a situation in which saving is negative.
D) the point at which saving equals zero.
Correct Answer:
Verified
Related Questions

