True/False
The figure below is an example of a negatively skewed distribution. 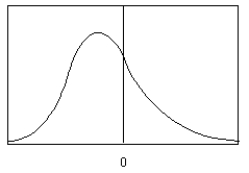
Correct Answer:
Verified
Related Questions
Q3: When the data values are evenly distributed
Q17: If a normal distribution has a mean
Q18: One normal curve has a mean of
Q18: When the majority of the data values
Q19: On an easy test, the mean score
Q21: The probability Q22: Find the area under the standard normal Q23: Find the probability P(-0.77 < z < Q24: Find the probability P(-1.09 < z < Q25: Find the probability ![]()
![]()
Unlock this Answer For Free Now!
View this answer and more for free by performing one of the following actions

Scan the QR code to install the App and get 2 free unlocks

Unlock quizzes for free by uploading documents