Two students were asked to rate six different television shows on a scale from 1 to 10 points, with higher values ranking ahead of lower values. The data are shown in the following table:  Which table shows the appropriate differences in the rankings needed in the computation of the Spearman rank correlation coefficient?
A) 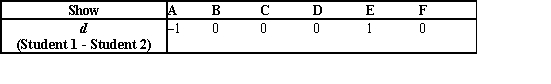
B) 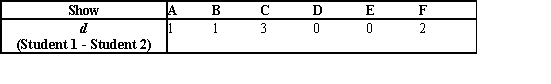
C) 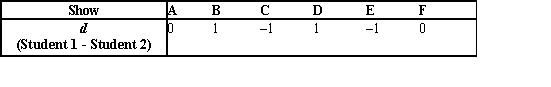
D) 
Correct Answer:
Verified
Q41: If a panel of two judges were
Q53: A researcher tests three different brands of
Q54: If the test value for a Wilcoxon
Q55: Test the following sequence of values for
Q56: Two students rated, then ranked seven different
Q57: An instructor divided her class into four
Q58: An instructor divided her class into four
Q59: A social studies teacher wanted to see
Q60: Find the critical value from Table L
Q63: How many runs are in the following
Unlock this Answer For Free Now!
View this answer and more for free by performing one of the following actions

Scan the QR code to install the App and get 2 free unlocks

Unlock quizzes for free by uploading documents