Determine the type of relationship shown in the figure below. 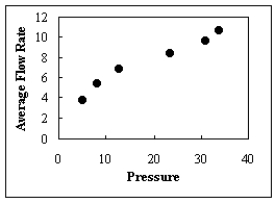
A) positive
B) negative
C) multiple
D) There is no relationship.
Correct Answer:
Verified
Q5: If there is a strong negative linear
Q9: Test the significance of the correlation coefficient
Q9: In a relationship, as one variable increases,
Q10: The population correlation coefficient is computed by
Q11: The rounding rule for the correlation coefficient
Q15: is a statistical method used to determine
Q16: Compute the value of the correlation coefficient.
Q17: An experiment is carried out to determine
Q18: Draw a scatter plot for the following
Q19: A study was conducted to determine if
Unlock this Answer For Free Now!
View this answer and more for free by performing one of the following actions

Scan the QR code to install the App and get 2 free unlocks

Unlock quizzes for free by uploading documents