The total blood cholesterol concentrations, in mg/dL, are shown below for a random sample of six people. In the table below, x is the age of the subject and y is the subject's total cholesterol concentration. Find the 95% prediction interval when x = 59 years. 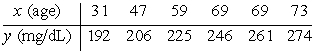
Correct Answer:
Verified
View Answer
Unlock this answer now
Get Access to more Verified Answers free of charge
Q51: If the correlation coefficient r is equal
Q52: The following data list ages of cars
Q53: The standard error of estimate can be
Q54: In a multiple regression model y' =
Q55: The prediction interval around y' for a
Q57: Compute the standard error of the estimate
Q59: If the correlation coefficient r is equal
Q60: The standard error of estimate is the
Q60: If the correlation coefficient r is equal
Q61: A multiple regression line was calculated in
Unlock this Answer For Free Now!
View this answer and more for free by performing one of the following actions

Scan the QR code to install the App and get 2 free unlocks

Unlock quizzes for free by uploading documents