Refer to the diagram below. The change in aggregate expenditures as shown from (C + Ig + Xn2) to (C + Ig + Xn1) might be caused by: 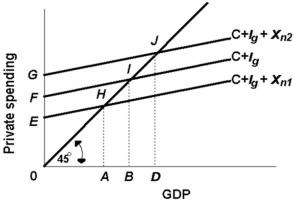
A) an appreciation of this nation's currency relative to the currencies of its trading partners.
B) a depreciation of this nation's currency relative to the currencies of its trading partners.
C) a decrease in this nation's price level relative to price levels abroad.
D) a rightward shift in this nation's aggregate supply curve.
Correct Answer:
Verified
Q93: Q122: In reality, if a nation imposes tarrifs, Q123: Which event would most likely decrease an Q126: In reality, if a nation devalues its Q127: The following information is for a closed Q134: Assume that an economy is operating at Q136: If net exports decrease from zero to Q137: Other things equal, if $100 billion of Q138: An exchange rate: Q155: Other things being equal, the effect of![]()
A)is the ratio of the
Unlock this Answer For Free Now!
View this answer and more for free by performing one of the following actions

Scan the QR code to install the App and get 2 free unlocks

Unlock quizzes for free by uploading documents