Exhibit 3.5
The following questions are based on this problem and accompanying Excel windows.
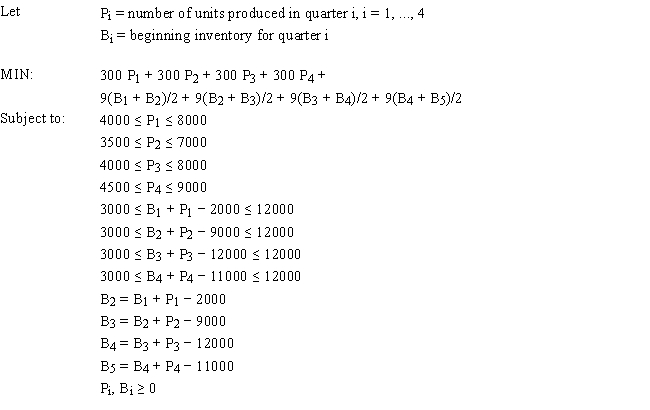
A company is planning production for the next 4 quarters. They want to minimize the cost of production. The production cost is stable but demand and production capacity vary from quarter to quarter. The maximum amount of inventory which can be held is 12,000 units and management wants to keep at least 3,000 units on hand. Quarterly inventory holding cost is 3% of the cost of production. The company estimates the number of units carried in inventory each month by averaging the beginning and ending inventory for each month. There are currently 5,000 units in inventory. The company wants to produce at no less than one half of its maximum capacity in any quarter. 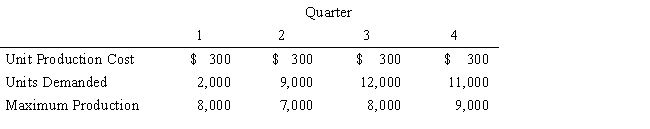
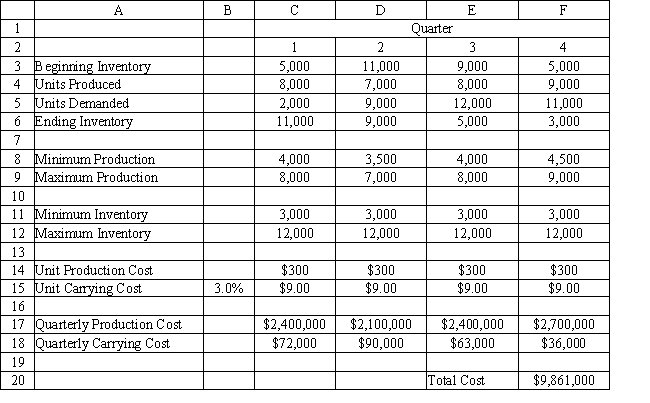
-Refer to Exhibit 3.5. Which cells are changing cells in the accompanying Excel spreadsheet?
A) C4:F4
B) C9:F9
C) F20
D) C12:F12
Correct Answer:
Verified
Q52: Exhibit 3.2
The following questions are based on
Q53: Exhibit 3.2
The following questions are based on
Q54: Exhibit 3.1
The following questions are based on
Q55: Exhibit 3.3
The following questions are based on
Q56: The constraints X1 ≥ 0 and X2
Q58: The hospital administrators at New Hope, County
Q59: Data Envelopment Analysis (DEA) is an LP-based
Q60: Microsoft Excel contains a built-in optimizer called
A)
Q61: You have been given the following linear
Q62: You have been given the following linear
Unlock this Answer For Free Now!
View this answer and more for free by performing one of the following actions

Scan the QR code to install the App and get 2 free unlocks

Unlock quizzes for free by uploading documents